The NYC Department of Health started publishing their Covid-19 test testing results on GitHub . One of their datasets tests-by-zctascv is, in their own words.
This file includes the cumulative count of New York City residents by ZIP code of residence who:
Were ever tested for COVID-19 (SARS-CoV-2)
Tested positive The cumulative counts are as of the date of extraction from the NYC Health Department’s disease surveillance database.
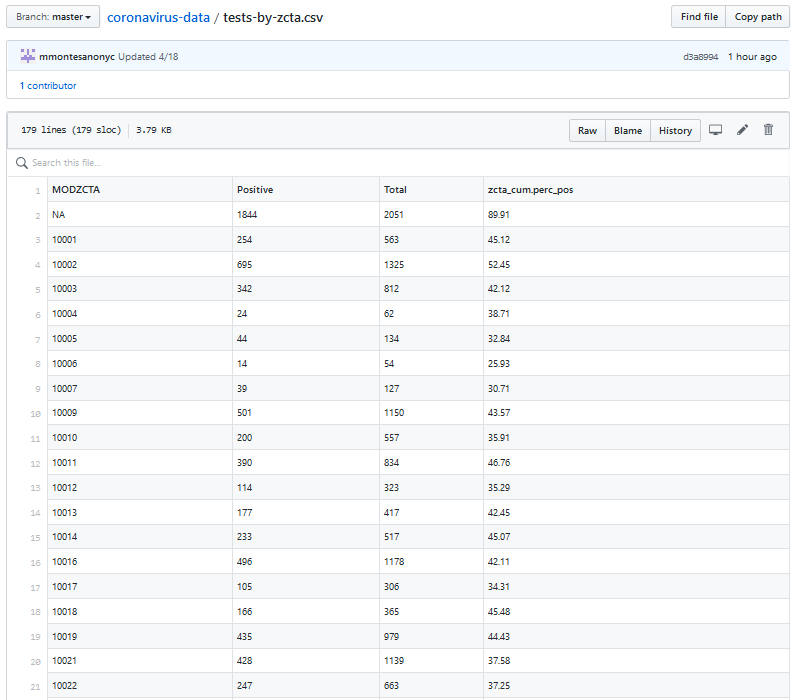
This file is updated almost every day and shows the number of people tested, the number who are found to have Covid-19 in each New York City Zip code. It also shows the the cumulative percentage of those tested who have the virus.
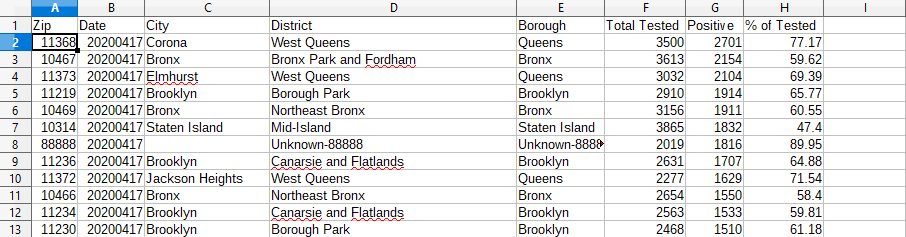
What I would like to add, is more detailed information for each Zip Code so that it makes more sense to me. For each zip code, I would like to add the borough, the town, or district in that borough. To make things a little more complicated, NYC boroughs are divided up differently. Manhattan addresses are “New York City”, Brooklyn, Bronx and Staten Island are their own cities for mailing address purposes. Queens however is different. Queens is broken up into towns like Flushing and Long Island City, Woodside, Jamaica etc.
In a previous post Creating A Simple JSON NYC Zip Code Database File With Perl and MooX::Options , I created a little database file to match the zip codes with the neighbourhood.
Now I created a new script to download the raw raw csv data from the NYC Department Of Health GitHub page and merge it with my little Zip Code database.
sub get_raw_covid_data_by_zip {
    my $self = shift;
    my @data =
      map { _conv_zcta_rec_to_hash($_) }
      split( /\r?\n/, get( $self->zcta_github_link ) );
    shift @data
      if ( $data[0]->{cumulative_percent_of_those_tested} =~ /zcta_cum/ )
      ;    # Dont need that header
    say "Got @{[ scalar @data ]} lines of covid data. Thanks Mr. Mayor";
    return \@data;
}
The above function uses the CPAN module LWP::Simple which exports the ‘get’ function to download the data from GitHub. The ‘split’ function breaks the data up into individual lines, which are fed into the ‘map’ function where each individual line of data is passed into ‘_conv_zcta_rec_to_hash’ which breaks the line into a Hash, which is enriched with some extra Zip Code location information.
sub _conv_zcta_rec_to_hash {
    my $str = shift;
    state $date_h = _get_date_h();
    my %h;
    (
        $h{zip}, $h{positive}, $h{total_tested},
        $h{cumulative_percent_of_those_tested}
    ) = split /\s*,\s*/, $str;

    ( $h{zip} ) = $h{zip} =~ /(\d+)/;
    $h{zip} ||= $NA_ZIP;    # There is one undef zip in test data
    $h{yyyymmdd} = $date_h->{yyyymmdd};
    return \%h;
}
Here’s a sample of one line of data as a hash element.
{
     cumulative_percent_of_those_tested => "42.44",
     positive     => "337",
     total_tested => "794",
     yyyymmdd     => "20200418",
     zip          => "10003",
},
The newly created array of hashes is then serialized to JSON format and printed to a file using File::Serialize . This will be my file database that I can use to provide other useful information.
sub create_latest_tests_by_ztca_file {
    my $self       = shift;

 my $covid_data = $self->get_raw_covid_data_by_zip();

   serialize_file $self->tests_by_zcta_db_json_file => $covid_data;

   say "Created a new " . $self->tests_by_zcta_db_json_file;
    1;
}
Printing the test results to a CSV file.
Printing this to a C.S.V file is easy enough with Perl and Text::CSV_XS.
sub write_latest_zcta_to_csv {
    my ($self) = @_;
    my @col_headers = (
        qw/Zip Date City District Borough/,
        'Total Tested', 'Positive', '% of Tested'
    );
    my @col_names = (
        qw/zip yyyymmdd city district borough total_tested positive cumulative_percent_of_those_tested /
    );
    my $csv       = Text::CSV_XS->new( { binary => 1, eol => $/ } );
    my $zcta_file = $self->get_todays_csv_file($ALL_ZCTA_DATA_CSV);
    my $z_fh      = $zcta_file->openw;
    $csv->print( $z_fh, \@col_headers ) or $csv->error_diag;

    for my $one_day_zip_rec (
        sort { $b->{positive} <=> $a->{positive} || $a->{zip} <=> $b->{zip} }
        @{ $self->tests_by_zcta_today } )
    {
        my $location_rec =
          $self->zip_db->zip_db_hash->{ $one_day_zip_rec->{zip} }
          || _get_filler_location_rec( $one_day_zip_rec->{zip} );
        $self->zip_db->zip_db_hash->{ $one_day_zip_rec->{zip} } ||=
          $location_rec;
        my %csv_rec = ( %$one_day_zip_rec, %$location_rec );
        $csv->print( $z_fh, [ @csv_rec{@col_names} ] );
    }
    close($z_fh) or warn "Failed to close $zcta_file";
    say "Created a new $zcta_file";
}
my $zcta_file = $self->get_todays_csv_file($ALL_ZCTA_DATA_CSV);
Uses a Moo attribute to return a csv file path with the current days timestamp.
for my $one_day_zip_rec (sort { $b->{positive} <=> $a->{positive} || $a->{zip} <=> $b->{zip} }@{ $self->tests_by_zcta_today } ){...
When reading the current days test results data, it is sorted by the positive results. Then it’s combined with the zip code location data for that zip code, and printed.
my %csv_rec = ( %$one_day_zip_rec, %$location_rec );$csv->print( $z_fh, [ @csv_rec{@col_names} ] );
Below is a sample CSV file for April 17 2020.
Next we can create nice Plotly charts to display the test results.